Consistency and Contrast #
last modified February 24, 2026
~6 minute read
Contrast is how you direct attention.
but
Consistency is how you enable contrast.
Let’s see how one can move from poor implementation to good implementation.
Lack of consistency #
Consistency is the foundation from which we build contrast. Thus, we must first ensure that our designs are consistent before we try to create contrast.
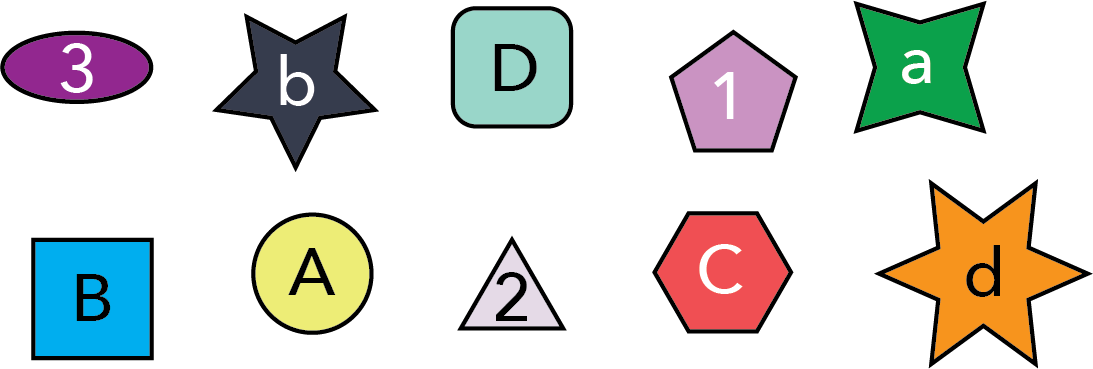
As an example of poor consistency, consider the shapes below. Each object incorporates a different size, shape, fill color, and text character. Because of this, each of these properties vies for our attention, making it hard to identify any single shape. For instance, imagine your goal was to draw attention to the text inside the six-sided shape. How long does it take you to find it? With so many elements competing for attention, nothing stands out.
Consistency #
Ultimately, we will use contrast to help us find the object of interest, but the first step is to make the elements as consistent as possible. When doing so, we need to consider which property we wish to focus on; that will be the property allowed to change. For instance, if we decide we want to focus on the text, then we should make all the sizes, shapes, and colors identical.
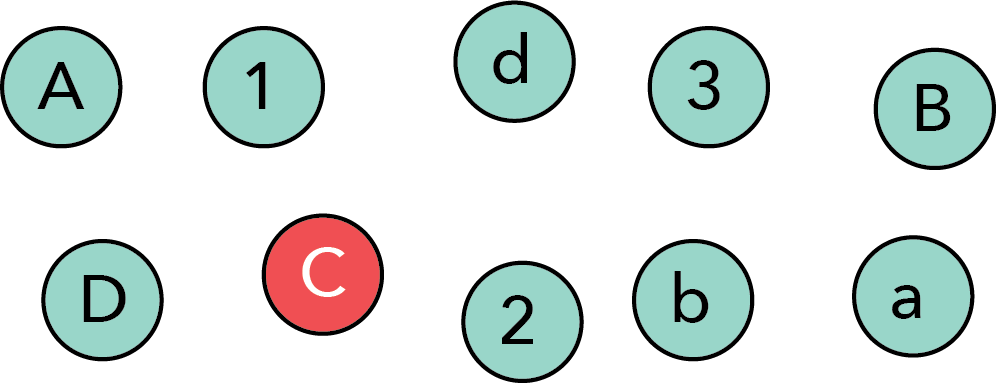
In this design, we have not yet created contrast, so it might still be difficult to locate a specific object (for instance, the upper case “C”). However, we have already improved communication with the viewer. When someone looks at the consistent design above, they will naturally focus on the differences in the text because that is the only difference they perceive.
Now that the viewer knows what property to focus on, we can use contrast to direct their attention to the specific object we wish them to notice.
Contrast #
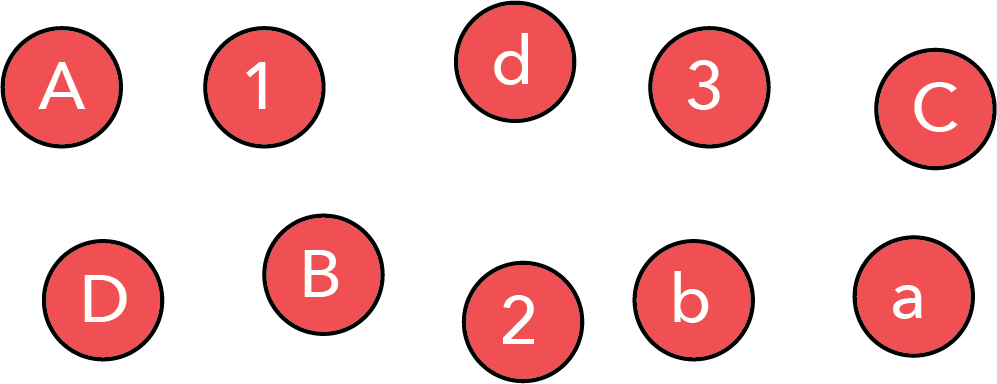
With a consistent design in hand, we can use contrast to create an image that naturally directs the viewer’s focus. To do so, we change one (or possibly more) aspects against the consistent background of shapes. Below, we made both the fill color and the text color very different for one object. If you ask anyone what they notice first in this image, they will say the shape with the “C.” Unless they have severe color blindness, it is nearly impossible not to notice this shape first.
Though it is easy to see the power of this contrast, there are two important points to make regarding its use…
Good contrast requires good consistency #
Though the red shape in our high-contrast image above stands out, it is not simply because the shape is red. Indeed, in the very first (inconsistent) image, the size and color of the object with the “C” was exactly the same, yet it did not stand out nearly as much. Thus, it is not the inherent property of an object that creates contrast (red isn’t inherently as attention-grabbing), but its properties relative to the consistent context you’ve established.
Good contrast requires large differences #
Not all differences are equal. When striving to create contrast, make the differences large in magnitude. If the changes are too subtle, the elements might merely look similar. We don’t want similarity; we want LARGE differences. We want contrast.
Consider the words “similar” and “LARGE” in the preceding paragraph. Both differ from the surrounding text (“similar” is italicized, while “large” is bold and capitalized). Which stands out more? For nearly everyone, it is the word LARGE—because its deviation from the baseline text is much greater.
Many aspects can provide contrast #
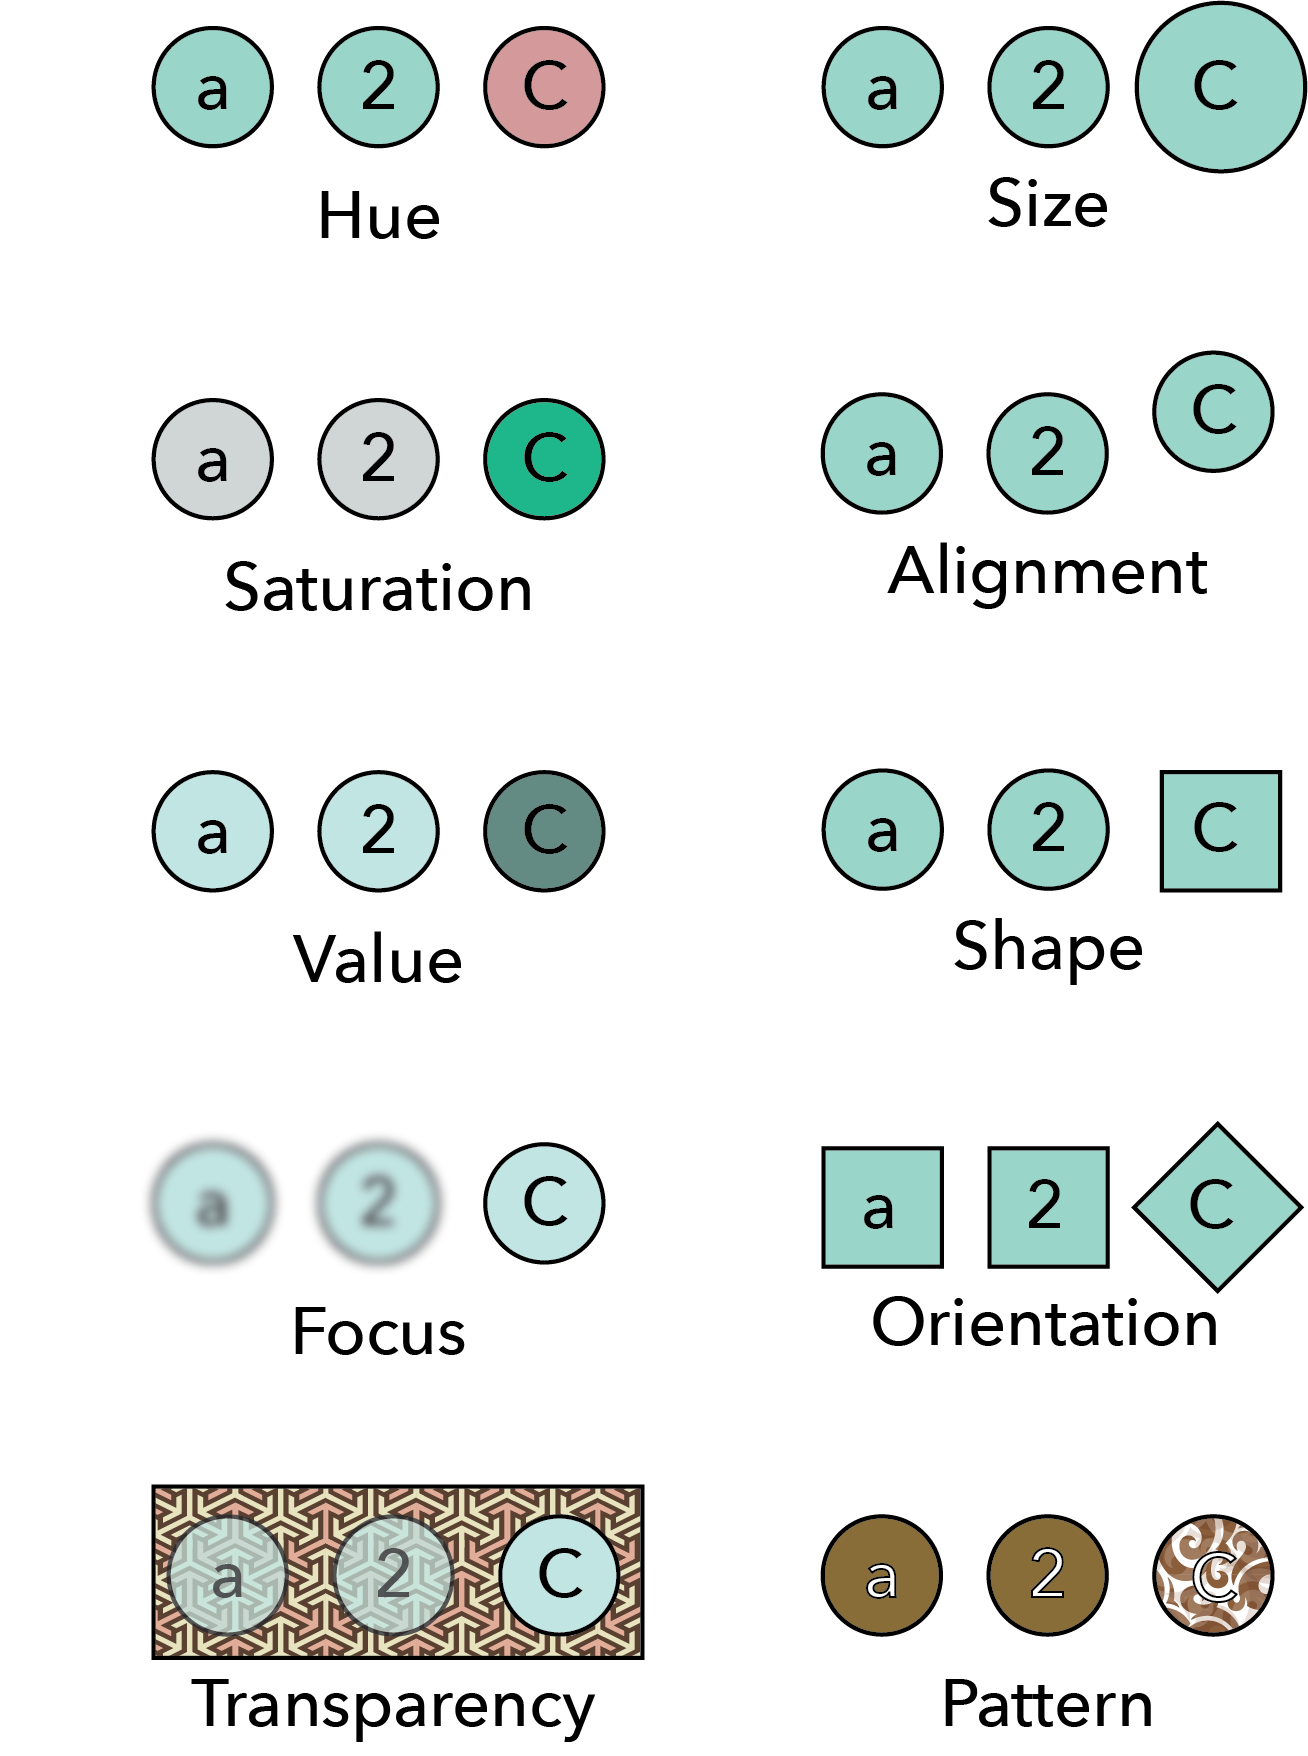
We used color in the previous examples to provide contrast, but while color is a common mechanism, it is far from the only one. An incomplete list of other means is depicted in the figure below.
Usage in data visualizations #
Just as in basic graphic design, consistency and contrast are used in data visualization to direct the reader’s attention. Consistency reduces the cognitive load required to process an image, while contrast draws that attention to the specific point of interest.
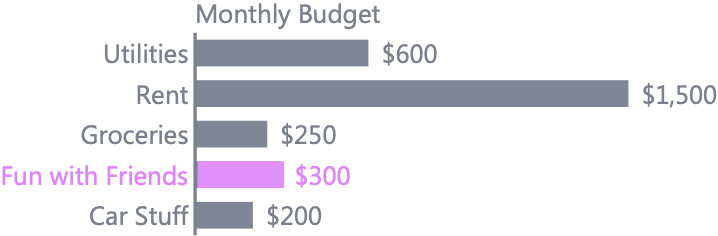
For example, imagine you have a bar chart where a single bar is the most important. You can keep all other bars visually consistent, and use contrast to highlight that specific bar.
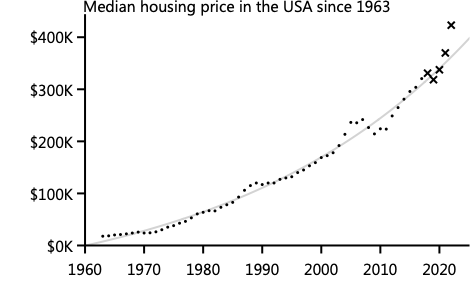
Of course, how you choose your color matters, and if you are interested in learning more on this, head over to the page on color. But there are ways to achieve contrast other than color. For instance, imagine that you had a scatterplot of old and new data. You might make the markers for the old data small and circular, while new data might be larger and an “$\times$”—creating good contrast without color.
Another, more subtle usage of contrast is to grey out non-data elements (e.g., axes, titles, and tick labels), as was done in the bar chart above, while keeping the data elements darker. Because many websites or journal articles have white backgrounds, black text has the highest possible contrast. However, the viewer’s focus should be on the data, not the axes. By reducing the darkness of the axes, you reduce their contrast with the background, naturally drawing more attention to the data. This is why many modern plotting packages (e.g., ggplot2, Seaborn) use grey or subtle axes by default. To explore this further, read the page on the design of axes.
A Workflow for Effective Design #
The core takeaway is simple: good contrast requires a foundation of good consistency.
You can turn this principle into practice with a simple, two-step workflow for your next data visualization:
-
Enforce Consistency First. Start by making every element as uniform as possible. Use the same color, size, shape, and font weight for all your data points, bars, or lines. Your initial goal is to create a clean, quiet, and consistent visual field.
-
Add Contrast Second (and Sparingly). Ask yourself: “What is the single most important message or data point I want my audience to see?” Then, and only then, change a single property (like color or size) of that one element to make it dramatically different from the rest.
Resisting the urge to emphasize everything is the key. When everything is emphasized, nothing is. Start with consistency, and you will wield the power of contrast with precision and impact.
Key takeaways #
- Consistency enables contrast: You cannot draw attention to a break in a pattern if there is no underlying pattern. Make everything uniform first.
- Good contrast requires large differences: Subtle changes simply look like sloppy consistency. Make the differences obvious and dramatic.
- Many attributes provide contrast: Color is the most common, but size, shape, orientation, and focus are equally valid.
- Grey out non-data elements: Reduce the contrast of non-essential elements like axes and grid lines so they don’t compete with your data.
page last modified February 24, 2026