The bar chart is a staple of data visualization. You will find them across all area of human endeavor, from homemade pamphlets about a local school system, to high powered presentations on wall street, to cutting-edge science journals.
Because they are so widely used, it is very much worth considering how best to design them.
How to construct/interpret a Bar Chart #
last modified August 3, 2025
~7 minute read
A bar chart is used to compare the magnitudes associated with various categories. For this reason, two different types of axes are used: a qualitative axis (on which the categories are spaced) and a quantitative axis (against which values are plotted). However, though the quantitative axis does exist, there is one critical thing to understand about bar charts: the relative area of the bars is meant to reflect the relative size. This is a theme that is common across other data visualizations, such as pie charts and Sankey diagrams. However, in those cases the relative area is more obvious and better enforced by plotting software. For bar charts, it is relatively easy to disregard this rule, and thereby make a poorly formed bar chart.
The fact that relative areas of bars are meant to be compared means two things.
- This is easiest with the bars are all the same width.
- This is only possible when the bars all start from a logical value.
Consider, for instance, some famous bad bar charts, such as these by Fox News and XXX.
IMAGES.
The problem with these is that, when comparing areas, the bars appear to represent very large changes… sometimes doubling! But when we plot them starting at a logical value—say 0—then the changes no longer look so large.
IMAGE <– corrected.
This is why it is important to start the bars at a logical shared value.
Note, I am being very careful not to say that you should always start at 0. Instead, you need to consider the data, and understand what the logical value is. In many cases, it will be 0, but you will also often find it is not.
For instance, imagine you had a chemical reaction, and you wanted to compare how much you have been able to increase the rate of reaction. In this case, you might consider plotting the ratio of the new rate over the old. In this case, using zero as the starting number makes no sense. Instead, 1 is a better value—representing no change in rate.
IMAGE.
In this plot, though we do not start at 0, the relative areas of the bars still reflect the relative rate enhancement under the conditions.
When to use a bar chart #
Use a bar chart when you have data that can be broken up in to categories, and each category has a quantity associated with it.
Design ideas for bar charts #
Below is a bar chart of gold medals earned by the top 6 countries at the Tokyo Olympics. This is plotted using defaults that are common across several different plotting packages.

We can work from this image to try to create a better bar chart.
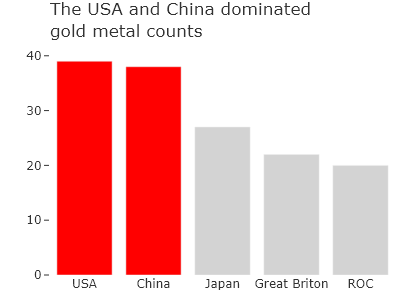
Add an effective title #
As discussed in the page on titles, I think the most effective titles are those that make a claim that is supported by the data. There are many different claims that could be made here, but let’s settle on one: “The USA and China dominated gold medal counts.” This focuses attention.

Use contrast to highlight bars #
Now that we have a title, we know where the emphasis should be. We can design the bars to do this. Perhaps we can make the USA and China bars stand out. This is the idea of using consistency and contrast to direct attention.

Remove grid lines and tick marks from the categorical axis #
Though many default plots include tick marks and even grid lines on the categorical axis, they are almost never needed. Consider that tick marks exist to help ensure the placement of the scale label is known. In the case of the categorical axis, this means showing the exact location of the labels “USA”, “China”, etc. But, we can ask two things about this. First, do we really need help assigning these labels? Is anyone going to be confused assigning “China” to the second bar? Second, do these labels even have an exact position? Not really. The label is for the entire bar.
The same line of reasoning applies to gridlines on the categorical axis, and so we can remove them as well.

Consider if you need gridlines or tick marks on the quantitative axis #
Grid lines and tick marks exist to help the viewer understand the scale of a plot. As argued in the page on Grid lines tick marks, they are not really present to help determine quantitative values. Thus, we can ask if we need these features to understand the plot or not.
In this case, the story being told does not rely on the exact numbers, and so there is no real need to have gridlines. We can get by with tick marks.

Remove shading from the plot area #
The plot area in this default has a color. There was two reasons for this. First, so that the white gridlines could be shown. Second, to help show the symmetry of the plot area (also functioning a bit like a grid line). Neither of these is needed for this story, and so we can remove the color. Doing so allows us to also reduce the darkness of the grey bars.

At this point, you could probably stop. This is already better than a large number of bar charts I encounter. But we can keep going to refine this even more.
Consider what axis titles you need. #
A pretty standard default is to add axis titles to all axes, which is generally a good idea. However, in the case of categorical axes, it may not be needed. For instance, if you read the title of this plot, and then looked the bar labels, you might conclude that the bars represent countries. Thus, you can leave out this title. If you think people could be confused by “ROC” you can always annotate this as “Russian Olympic Committee”.
Depending on the exact plot title you settle on, you may not even need the axis title on the y-axis. In this case, I think that it is clear enough, so can also remove this.

Consider the order of bars #
Ordering is an important design decisions that can support the story you are trying to tell. Since our story is about the number of medals, it might make more sense to order the bars by magnitude, rather than by alphabetical order.
Consider if vertical bars are best #
In my opinion, horizontal bars are almost always better than vertical bars. Why? It makes labeling of the bars easier. For instance, you can see how the label “Great Briton” is a bit wider than the bar is labels, and this crowds the other labels a bit. If you use horizontal bars, however, this goes away.
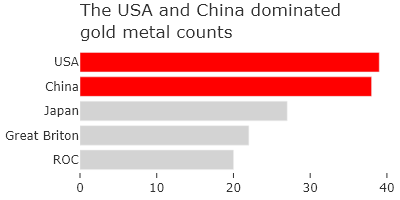
As an additional advantage, the bars can be made more slender as well, which helps reduce the space occupied by the charts, and emphasizes the length, which is the parameter of most interest.
Consider direct labeling of values #
It may often be the case that the quantitative axis does not need to be shown at all. Instead, one can provide the quantities directly next to each bar. And if you color coordinate the direct labeling and the bar labels, you will create an even more consistent design.

Concluding thoughts #
Bar charts are very widely used and so learning the basics of how to control their design will pay dividends repeatedly. Above, we have seen several ideas on how to do so. I think the best ideas can be summarized as follows: ruthlessly cut out what is not strictly needed for communication. People are very familiar with bar charts as a communication tool, and so you can get away with removing quite a bit. Additionally, consider running your bars horizontally, which I think is the correct choice 90% of the time, if not more..
Tutorials #
page last modified August 3, 2025